
Supply chain from filings — data terminals usually charge for
Supplier and customer maps from public filings are a standard institutional dataset. FactSet, Bloomberg, and Cap IQ sell them behind terminal contracts. The raw material is already public — footnotes, segment notes, major-customer tables — just scattered across markets and languages.
OpenFilings now reads that layer and puts it on the same company object as filings and KPIs.
What terminals sell
A usable supply-chain view answers:
- Who does this company sell to, and who supplies it?
- What share of revenue sits with each named (or lettered) counterparty?
- Can I walk one more hop — my supplier's largest customer?
That data usually lives in a separate product SKU from filings. Teams stitch two vendors, two entity IDs, two refresh calendars.
What OpenFilings ships
We extract supplier and customer relationships from regulatory filings across US, Japan, Korea, China, Hong Kong, Taiwan, and Europe, then normalize them into one shape:
- Named edges — counterparty linked to a company in our catalogue when the filing names them
- Revenue share — concentration % when the company disclosed it
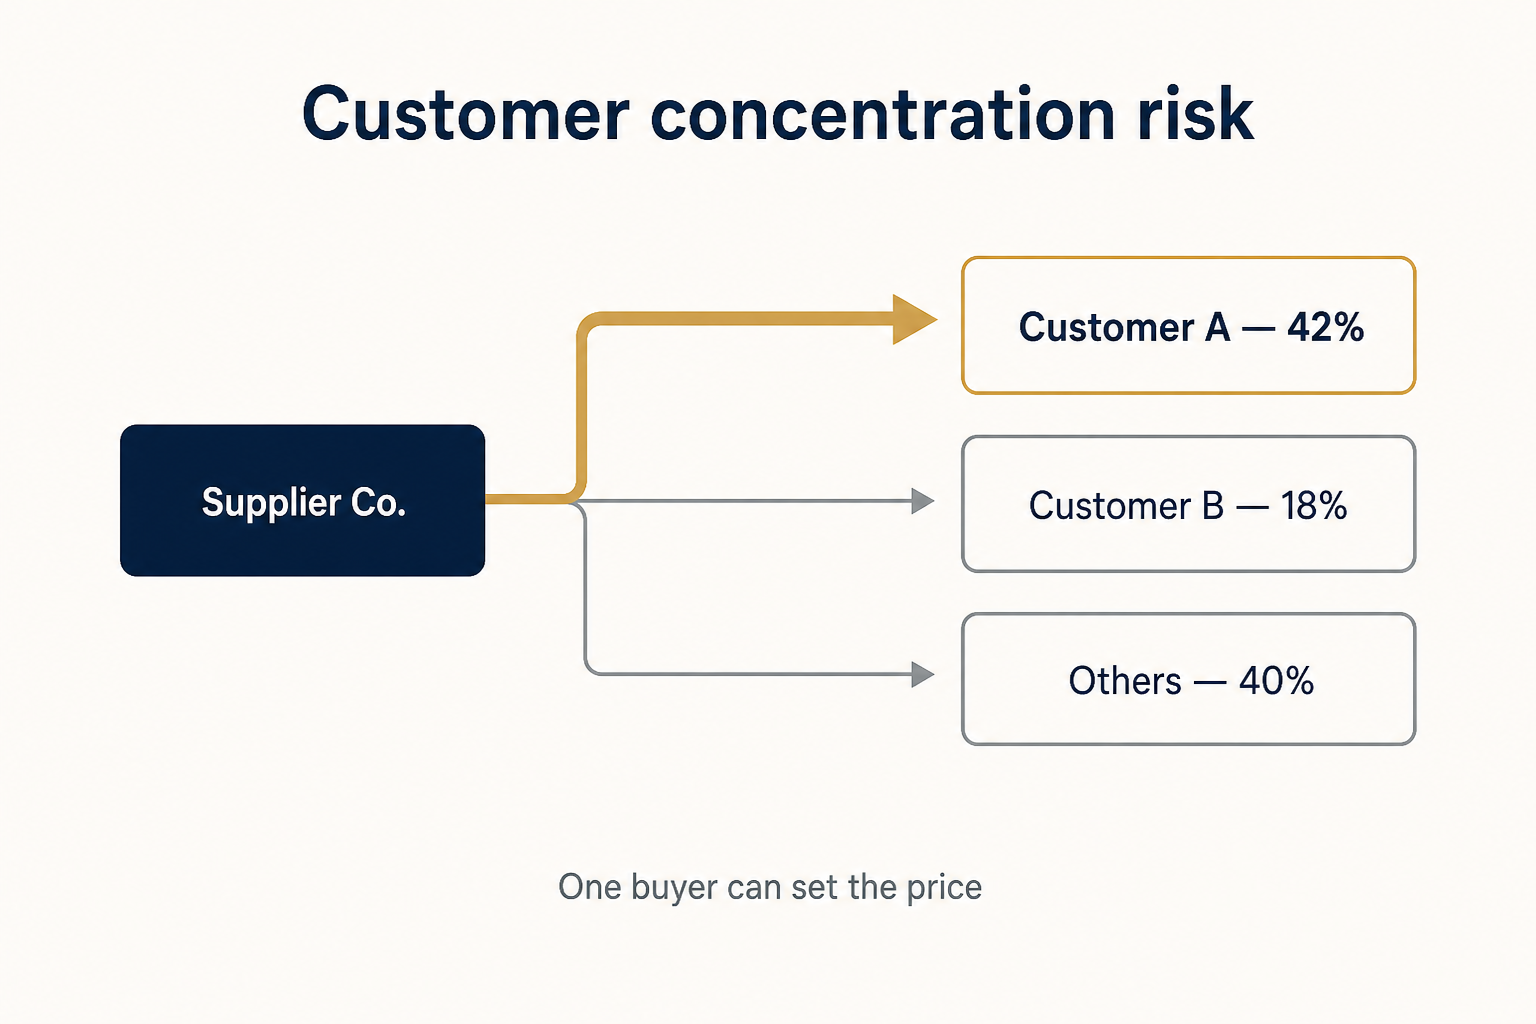
- Anonymous disclosures — "Customer A — 23%" stays lettered; we do not invent the name
- 1–2 hop graph — direct counterparties, then one step further when those companies named someone too
- Source filing — every claim links back to the period and document it came from
Same vocabulary whether the footnote was a US concentration note, a Japanese major-customer table, a Chinese top-five list, or an IFRS segment disclosure.
Available on company pages, the supply chain explorer, the REST API, and any agent connected to OpenFilings.
Why the concentration % matters
Ratios describe a company as if revenue came from a diffuse market. For many industrial and component businesses, a handful of buyers write the terms.
A holding at 40% single-customer concentration is a different instrument from a sector median at 8%, whatever the margins say. Just-in-time suppliers often hold weeks of visibility, not quarters. Two positions in different sectors can both depend on the same customer's capital budget — diversification on a price chart will miss that; reading who pays whom will not.
Walk one hop out when the data allows: your holding sells to a mid-cap that itself depends on one platform customer. The demand shock originates two steps away.
Try it
Open NVIDIA's supply chain, or pick any issuer in the explorer. Ask an agent who a company's customers are — the answer comes with the filing behind it.